

The Kids Count Data Book from the Annie E. Casey Foundation offers an important annual look at the well-being of children in each state, with Kentucky Youth Advocates as a key partner in the work. The 2019 edition is out now, and here comes a tour of the Kentucky data points that get spotlight attention.
Challenges outside education
 Let’s start with some challenges that are a step outside the education issues I usually write about. In the most recent data available for Kentucky:
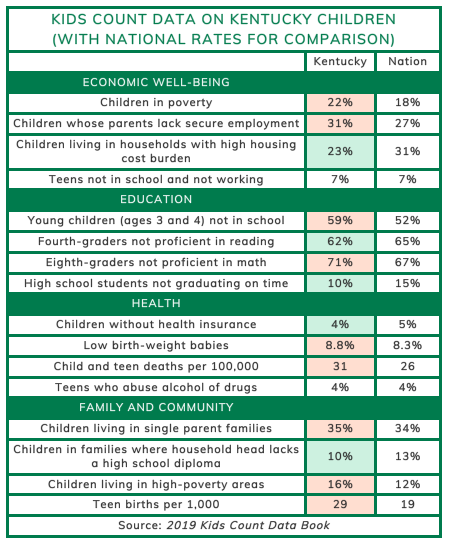
- 4% of children had no health insurance
- 4% of teens had abused drugs or alcohol
- 7% of teens were not in school and not working
- 8.8% of babies had low birth weights
- 10% of children lived in homes where the head of household lacked a high school diploma
- 16% of children lived in high-poverty areas
- 22% lived in poverty
- 23% lived in households burdened by high housing costs
- 31% had parents who lacked secure employment
- 35% lived in single-parent families
- 31 children and teens died per 100,000 young people
The Data Book also reports that:
- 29 babies were born to teen mothers per 1,000 female residents aged 15-19
That’s a widely respected way of stating the data. Still, I worry that it can hide the scale of the challenge, so here are two other ways to think about the same information:
- 7% of babies (4,060 of 54,637) born in 2017 were born to mothers 15-19 years old
- More than 10% of very young women seem likely to have given birth. Women who were 19 in 2017 were 18 in 2016 and 17, 16, and 15 before that. In principle, over five years, 2.9% giving birth each year could multiply into 14.5% being mothers before they turned 20. Since some will have had more than one child, I offer “more than 10%” as a rough sense of how many may be mothers before they turn 20.
For Kentucky to be a great place for all children, we need to see all these challenges, support the children already facing them, and work toward a commonwealth where these challenges emerge far less often.
Some national perspective
Even while longing to improve every statistic above, I try to maintain my comparative bearings. Every number indicates a difficulty for young Kentucky residents, but we should still know that:
- Three of the twelve indicators above are stronger than the national ones: health insurance, household diplomas, and housing cost burden.
- Two results match the national rates: drug/alcohol abuse and teens out of school and work
- Seven are weaker than the national rates: deaths, births to teen mothers, low birth weight, living in high poverty areas, family poverty, insecure employment, and single-parent families.
The education data
This year’s Kids Count Data Book also reports four Kentucky education results, each from a data source also used for Prichard Committee Top 20 reports.
- 59% of young children (ages 3 and 4) were not in school
- 62% of fourth graders were not proficient in reading
- 71% of eighth graders were not proficient in math
- 10% of high school students did not graduate on time
All of four indicators call for us to deepen our education-focused efforts. That’s true for the preschool and math results, which are worse than the national equivalents, and it’s also true for the reading and graduation rates, which are better.
Rankings for the Kentucky data
Using the indicators discussed above, Kids Count compared the 50 states, Puerto Rico, and the District of Columbia. Among those 52 jurisdictions, the report places Kentucky:
- 25th for health
- 27th for education
- 37th for economic well-being
- 43rd for family and community
Take moment to compare those rankings: they show our children as coming to our schools with higher-than-usual challenges –in the bottom third economically and in the bottom fifth on other family and community supports— but still right in the middle of the pack on educational measures.
Finally, the report combines all the indicators to place Kentucky:
- 34th for overall child well-being
For those who think of Kentucky as worse off than nearly every state, that’s another small corrective. For those who want all our kids to do well, it’s still an unhappy result.
A concluding note
Every indicator above should summon us to new effort. From start to finish, the Kids Count reporting is designed to make us pay more attention to the lives of children around us, try harder to help those children flourish, and dig deeper to ensure that each one’s full potential can be realized as they move toward adulthood. Let’s use this data to do just that.
To go deeper on the Kids Count reporting, check out the full Data Book, the even richer on-line Kids Count Data Center, and this great WEKU interview with Terry Brooks of Kentucky Youth Advocates.
Below, there’s one more way to see all the indicators for those how want to make a systematic comparison. I’ve used orange and green to give a quick look at where Kentucky’s results are weaker or stronger than national ones.
Comments are closed.