Following up on yesterday’s post about public higher education institutions’ graduation results for Black students, let’s go a deeper and look at the pipeline leading toward those graduations. Here’s a starting view of some key metrics:

Beneath those statistics, there are important trends, including
- rising high school graduations
- declining college-going and enrollment
- and rising numbers of credits earned and rising postsecondary completion rates.
Here come more detailed views of those trends, with green charts where we’ve improved what we deliver for Black students, and orange ones where our delivery has grown weaker over recent years.
Rising Numbers of High School Graduates
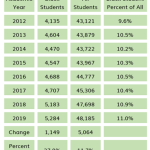
From 2012 to 2019, the number of Black students graduating from high school has grown steadily, and grown faster than the total numbers graduating from high school.

Declining College Going Rates
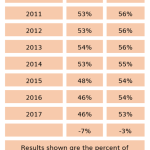
From 2011 to 2017, the percent of Black public high school graduates who go on to college has declined steadily, and declined faster than the equivalent percent of all high school graduates.

Do notice that for each listed year, this metric only includes those who just finishedat Kentucky high schools. It’s an indicator of those students’ initial choices about continuing their educations.
Declining College Enrollment
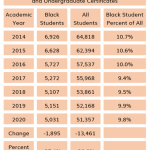
From 2014 to 2020, the total number of Black students enrolled at KCTCS has declined steadily, and declined at a faster rate than enrollment of all students. At the start of this period, Black enrollment at KCTCS did line up with Black residents being 10.6% of all Kentucky residents aged 18 to 24. That alignment slipped away over the later years.

Kentucky public universities did not enroll Black students in proportion to their share of the population at any point between 2014 and 2020, and they lost Black enrollment at a quicker pace than they lost students overall.

Increasing credits earned in the first year in college
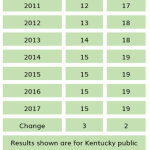
From 2011 to 2017, the average number of academic credits earned by first-year Black college students in Kentucky improved, and improved more than the average for all students.

Increasing credentials received
As noted yesterday, at the end of the pipeline, both KCTCS and the public universities have improved their delivery for Black students. From 2014 to 2019, the numbers of Black students receiving undergraduate credentials rose, and rose faster than the numbers for students overall.
Some concluding notes
These results show both secondary and postsecondary schools succeeding in improving graduation outcomes for Black students. That’s valuable improvement. State-level policy and classroom-level improvement may both deserve a share of the credit.
These results also show growth that is not yet close to delivering for Black learners in proportion to their share of Kentucky’s college-aged population. At each step in the learning pipeline shown here, Black students are a smaller share of total beneficiaries. Big commitment and big exertion to change that pattern are far past due.
One more thing about the outcomes: the tables above include an ominous trend in enrollment. Statewide, college-going rates and undergraduate enrollment have been declining, and both have been declining faster for Black students than others. In the coming years, we cannot expect to continue increasing the number of Black students earning postsecondary credentials if we don’t find ways to increase the number of Black students who seek to those credentials.
And one more thing about reporting these outcomes: this post used data from three different websites and showed similar but not identical years. I can imagine a better form of reporting, one that says something like this:
For every 100 Black students who entered ninth grade in a Kentucky public school in 2009, X graduated from high school in 2013, Y enrolled in Kentucky public higher during the following year, and Z received a degree or other credential by 2019. For White students, the equivalent numbers were….
Kentucky’s student data systems are capable of providing that kind of sequenced information, and I think it’s time for those of us who analyze and share out education statistics to create that kind of reporting. Let’s make it easier to see how Kentucky’s education systems are working for Black learners and where new commitment and effort are most needed.


Comments are closed.