Monday, I shared some major points from the Council on Postsecondary Education’s most recent progress report. For attention to equity, that report gave clear information on progress in graduating low-income students, but there’s more to be said about what’s happening for students of different racial and ethnic backgrounds.
Looking at changes from the 2015 to the 2019 school year, Kentucky public higher education mostly has growth in earning credentials for every identified group except American Indian or Alaskan Native students. That one decline, though small, should remind us of the need for careful attention to inclusion and opportunity for student groups which have been long underserved. Kentucky institutions delivered notable growth for other groups, including increases of more than 50% for Latino students and students of two or more races.

For the two largest underrepresented groups, we can also take a deeper dive, looking at each year and each type of credential.

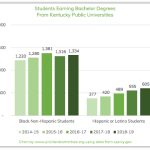
For Latino students seeking bachelor degrees, our universities have delivered steady growth. Rapid increases in Kentucky’s Latino population and high school completion by Latino students has probably contributed to this pattern, along with new postsecondary policy concern and incentives to support students from underrepresented minority groups.
For African American students, the delivery has been more uneven, with the number of students receiving bachelor degrees declining in 2018 and declining again in 2019. That’s not as healthy a pattern, and it deserves public attention and concern.
For associate degrees patterns are similar. KCTCS has produced steady growth for Latino students, but allowed 2016 to be the top year on delivery for African American students, with two years of drops after that and a partial rebound for 2019.

KCTCS has increased the total number of students earning undergraduate certificates substantially in recent years, and in that category, the results delivered for both Latino and African American students have shown fairly steady growth.

Finally, diplomas from KCTCS are a small part of the total credentials awarded, but the trends have been similar, with ongoing growth in results delivered for Latino students and uneven change for African American students, though with 2019 looking stronger than 2015.

As our economy moves into recession and our schools work to support learning under new social distancing rules, the challenge of delivering excellence with equity seems likely to intensify. As the road gets harder, we must press on: Kentucky must continue seek and implement the strategies that will work for each group of students, sustaining recent growth for Latino students, building more consistency for African American students, and developing the talents and potential of all Kentuckians.


