The Kentucky Center for Statistics (KyStats) is offering a new way to understand high school graduates moving into adulthood, higher education, and careers. Check out 2022 Life Outcomes for 2015 Kentucky Public High School Graduates, showing postsecondary attainment and median incomes for each attainment level. It’s powerful data with powerful visualizations, and my first response is WOW! I want to encourage everyone to check it out for themselves, so here comes a quick sampling to lure you in.
The Main Idea
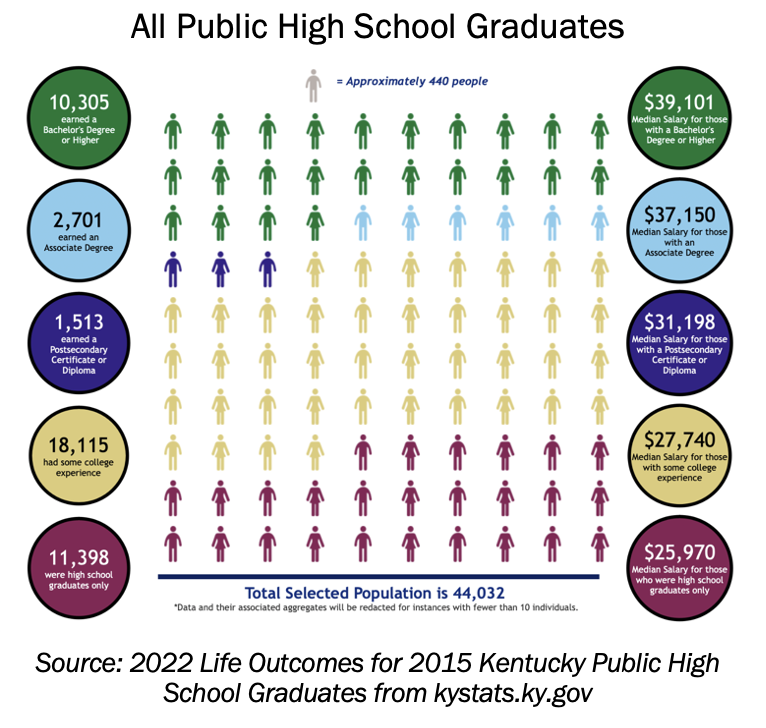
Here’s a look at the display for all 2015 graduates from Kentucky public schools.
Notice how added attainment links to added income: a postsecondary certificates or diploma adds more than $5,000 to median incomes, and associates and bachelor degrees add even more. That’s a new way to show that education has economic pay-offs.
Also notice who has received those credentials: about one-third of the high school graduates have reached one of those three attainment levels. The Council for Postsecondary Education has set a goal of 60% attainment for Kentuckians 25-64 by 2030, and this 33% is a reminder that we’ve got a lot of work to do on expanding who receives those economic returns.
I do want to whisper one more point about this display: it doesn’t show us those who didn’t finish high school. More than 6,700 Kentuckians started high school in the fall of 2011 but did not receive diplomas in the spring of 2015 with their classmates, as shown in the graduation rate data at kyschoolreportcard.com. There may be important data barriers that keep them from being included, but if they can’t be shown, I want to be sure we notice their absence.
Pathways Starting In High School
This is a dazzling part of what KyStats has created: you can look at how specific high school opportunities flow into earning credentials and changing incomes.
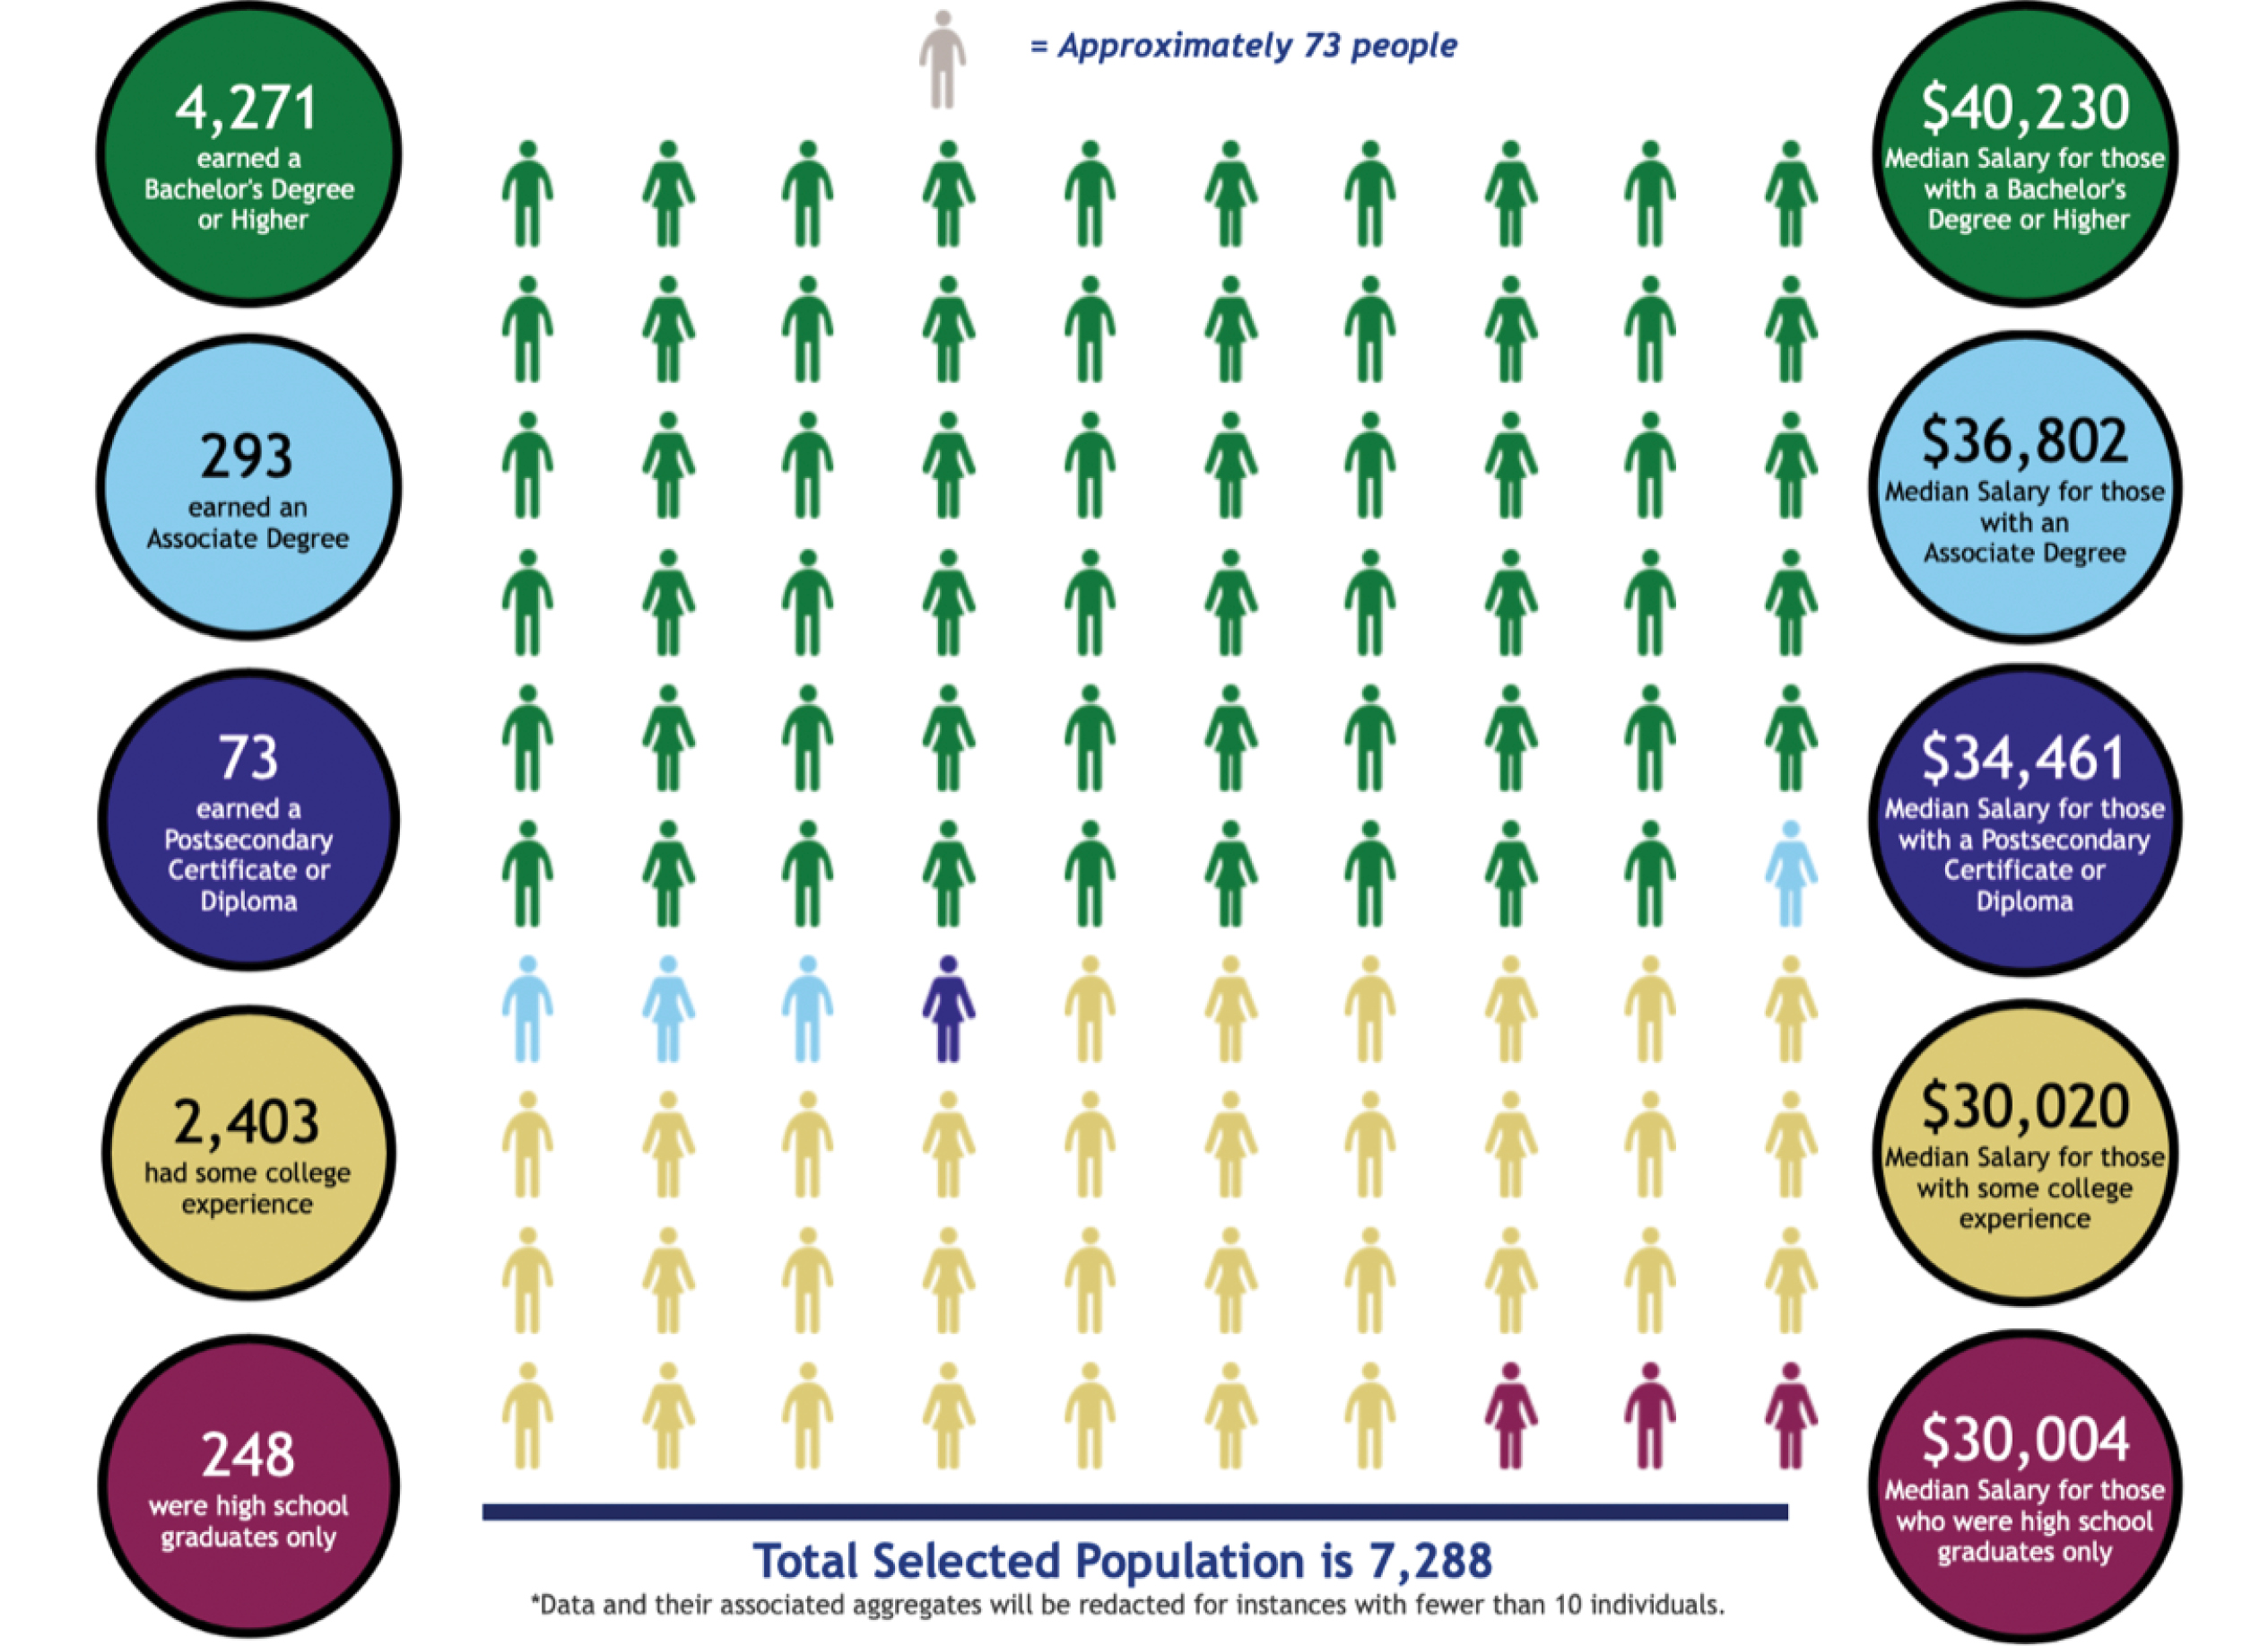
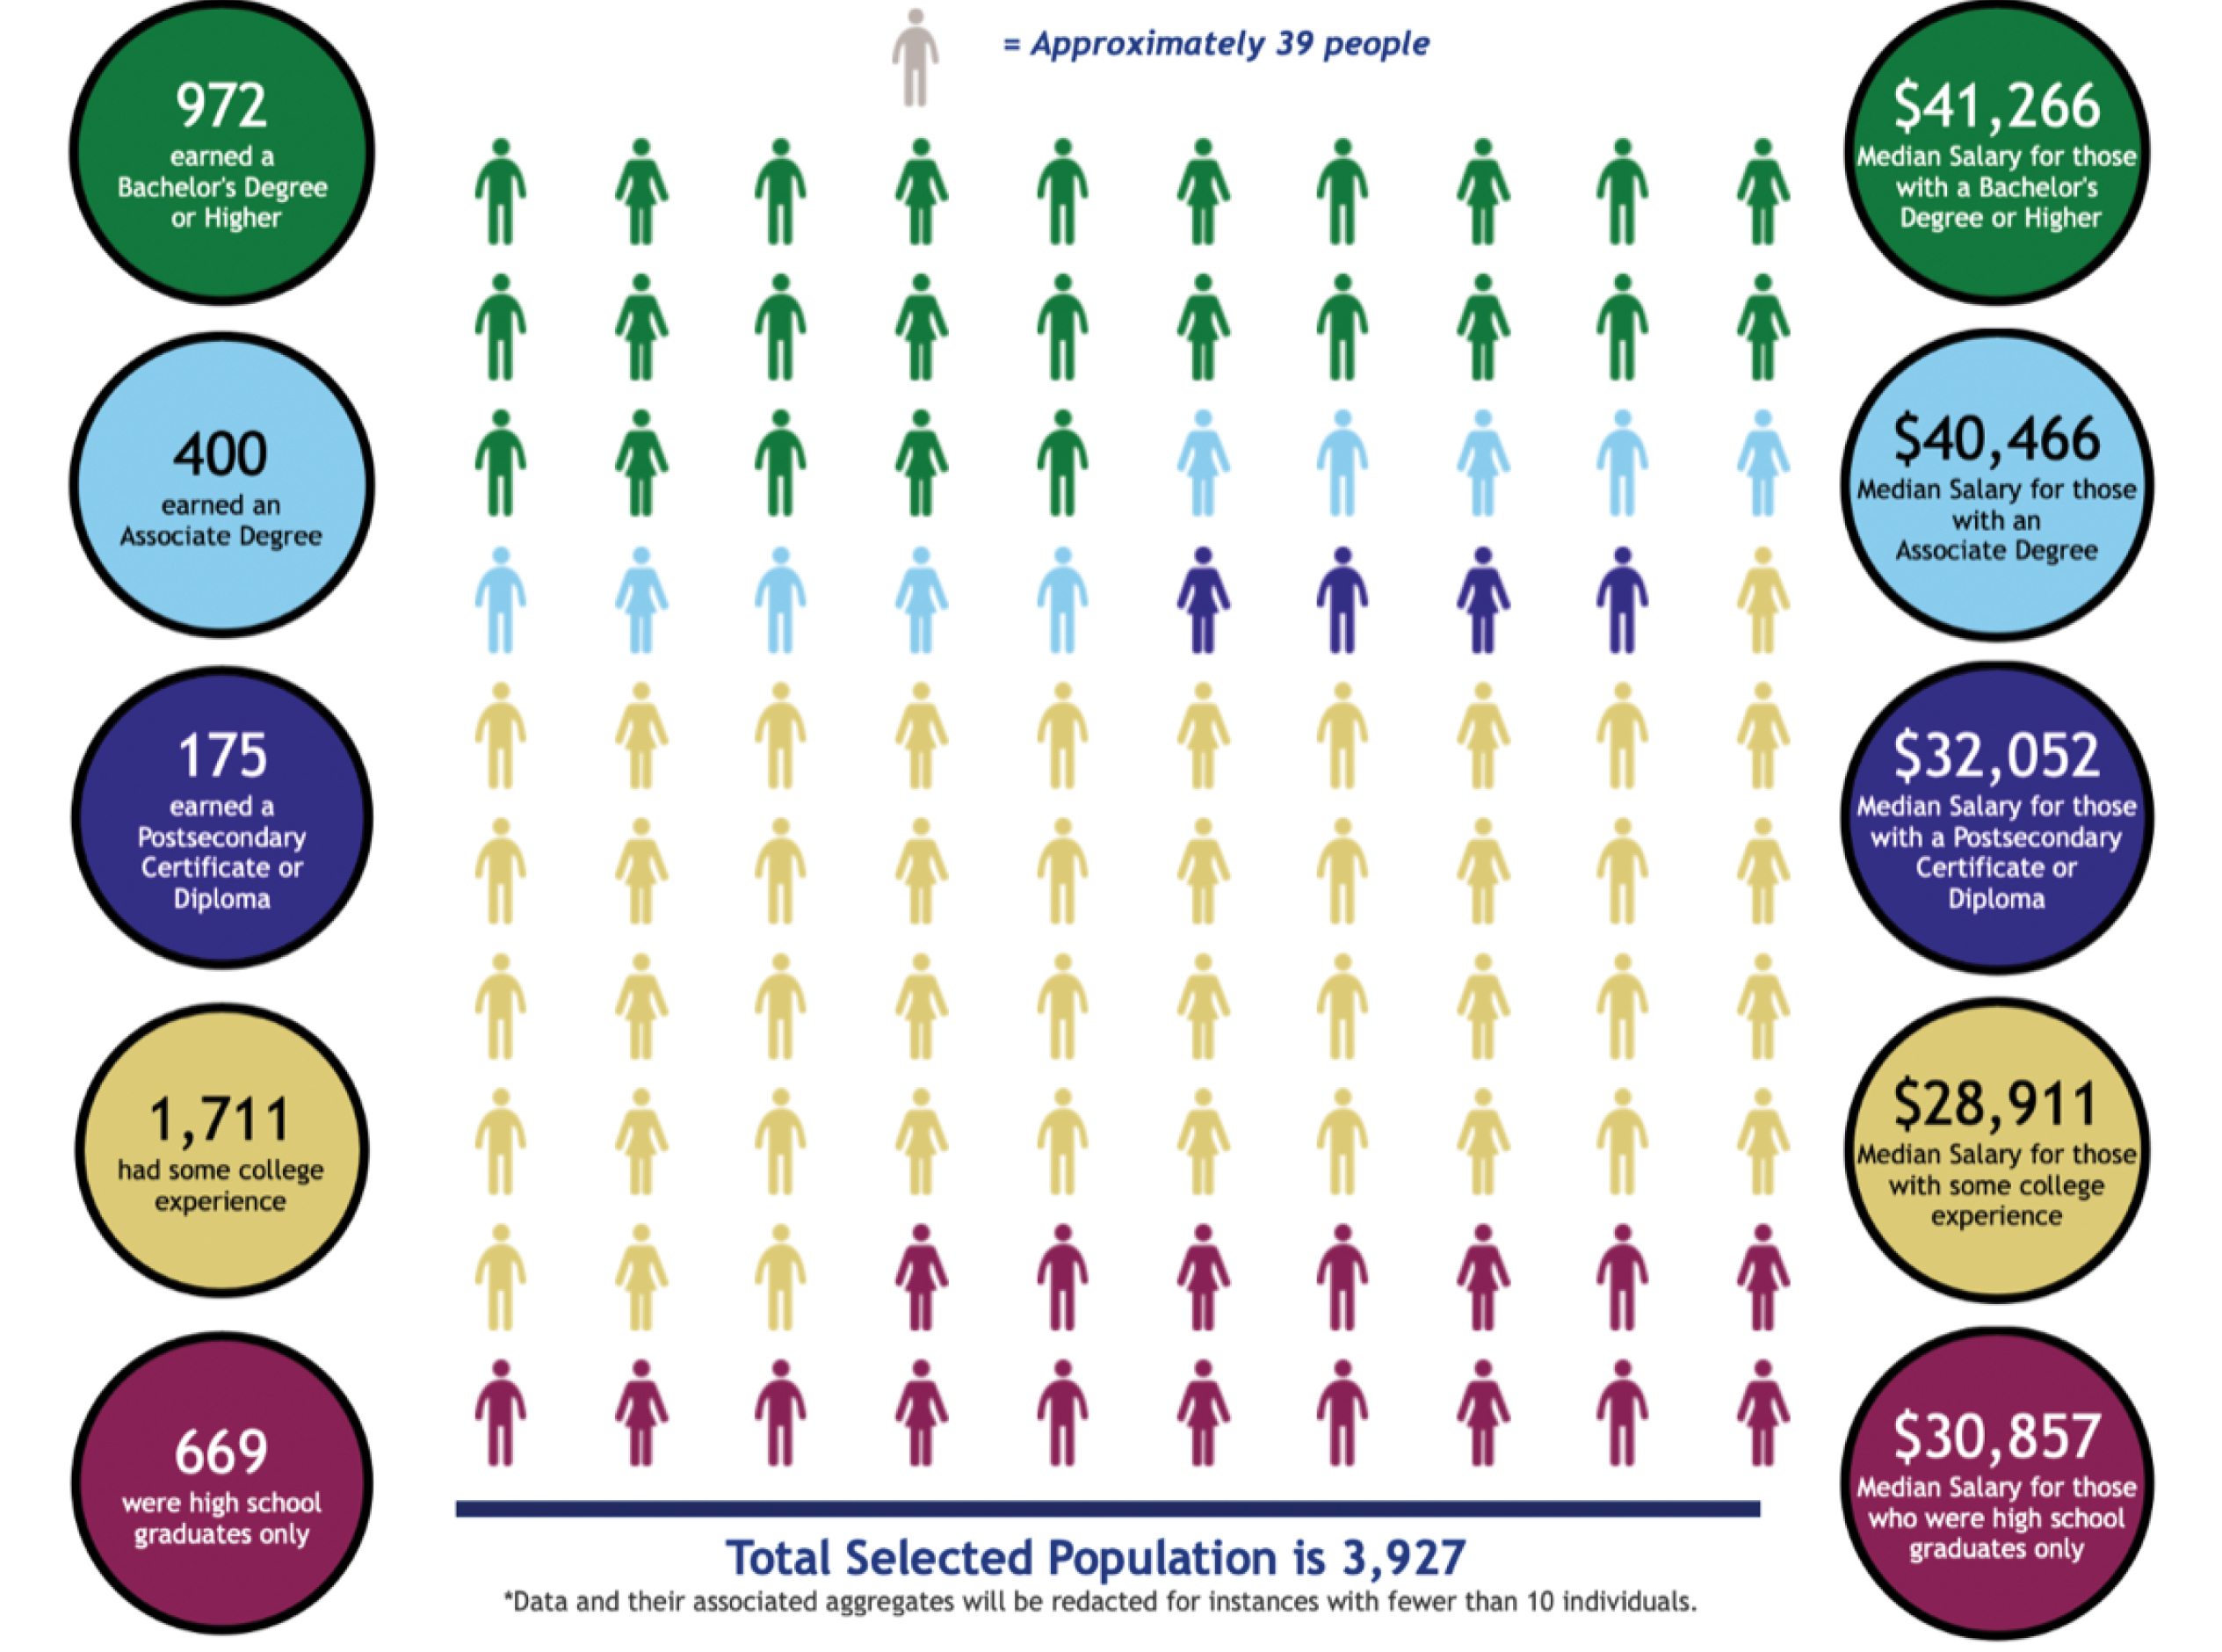
To whet your appetite, I’ll share what you can see about students who earned AP credit and students who engaged in work-based learning in high school. The AP group is larger, and it’s clearly earned more credentials. But notice the median incomes! The work-based learning group earns a higher return on bachelor degrees, on associate degrees, and on moving forward with no college at all.
Source: 2022 Life Outcomes for 2015 Kentucky Public High School Graduates from kystats.ky.gov.
Data displays like this matter in part because they invite so many new questions. For me, this information led quickly to realizing that I want to know more about work-based learning. For example: what fields of work are included in work-based learning? Is work-based learning available statewide, or could we make some smart investments in expanding it?
Lots more to see!
The Life Outcomes report will also let you trace patterns:
- For graduates who followed other high school options, including dual credit and career technical education
- For male and female students
- For students who were and were not economically disadvantaged
- For students of varied racial and ethnic backgrounds
- For students from Appalachian and non-Appalachian Kentucky
I hope you’ll check out all of that, identify your own questions, and take some next steps to explore. The Life Outcomes report is a big advance in our ability to understand how education is working as a path to a larger life.


