What is Affordability?
Nothing like restating the obvious question! But we have to start with what students really have to pay. And this is where Kentucky might have a bright spot or two – in case you thought the trends in Part I of this blog were depressing.
When we focus only on rising tuition costs, it leaves out other important cost and resource considerations – namely room, board, and other living expenses, as well as resources students get from financial aid. When you combine all this together, you get to the clearer measure of real costs to students – Net Price – the amount left over to be covered by student resources (i.e. savings, student debt, work). The basic calculation looks like as follows (thanks to 55,000 Degree Opportunity Costs Report for the illustration):
- Net Price = Cost of Attendance – Grant Aid
- Cost of Attendance = Tuition/Fees + Room/Board + Books/Supplies + Transportation/Other Costs
- Grant Aid = State (i.e. KEES Scholarship, CAP Grants), Federal (Pell Grants), and Institutional Aid
Kentucky, relatively speaking, is a high aid state on a per-student basis. According to the College Board’s 2019 Trends in Student Aid report, Kentucky provided the 6th most state grant aid per full-time equivalent student. While a significant portion of this aid flows to recent high school graduates through the mainly merit-based Kentucky Educational Excellence Scholarship (KEES), all students that are eligible for federal Pell grants are also eligible for the need-based College Access Program (CAP) grant. These aid programs, to those receiving funds, reduce the net price.
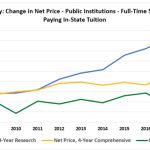
The average net price at Kentucky institutions has increased less than tuition, and actually has been trending downward at 2-year community colleges.

Source: U.S. Department of Education, Integrated Postsecondary Education Data System (IPEDS)
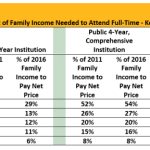
More telling for understanding actual affordability to different groups of students is to view net price as a share of family income, by income level and type of institution. You can see rather dramatic variations in the percent of family income needed to pay for school. For example, those at the lowest income range (less than $30,000) paid 4% less at 2-year colleges between 2011 and 2016, but 27% more at 4-year research campuses.

Source: Southern Regional Education Board (SREB), 2019 Kentucky College Affordability Profile.
At this point we have looked at a lot of data, and I am still pretty confused. There is tuition, state investment, financial aid, and that ever present student debt -(which can be viewed, in part, as investment given the financial return to getting more education). Is there a way to stitch all this together in a way that is useful?
Modeling Affordability – An Interactive Tool to Inform State Policy
College affordability is complex. Looking at tuition and state aid alone provides an incomplete picture of what education costs and what resources are available to help pay. Leading up to major changes in the state of Washington’s financial aid programs, experts in that state developed an interactive model for college affordability. We were grateful to have the designer of this model, Dr. Jim Fridley, present this tool during our work last year – as well as to the Council on Postsecondary Education for assistance in getting Kentucky data into the model.
Through visualizing the issue of affordability, the model helps connect key data, see how funding sources are coordinated, and to consider how to better communicate expectations to policy makers, institutions, students and families.
So how does it all stack up? The model sets resources to pay for college against the total cost of attendance and varying levels of family income. These resources include estimates of family contributions, federal aid (Pell Grant), state financial aid, institutional aid, and expectations for part-time work and student borrowing. Since opinions vary about what some of those estimates should be, the model allows changes to the assumptions and expectations in real-time so stakeholders can consider different options.
The examples described here consider how Kentucky’s main state financial aid programs – the College Access Program (CAP) and Kentucky Education Excellence Scholarship (KEES) – interact with other resources a student may have to pay for college.
State in Focus – Washington
For 50 years, Washington’s State Need Grant (SNG) has assisted low-income students with the costs of postsecondary education. The state’s commitment to the SNG program has it ranked 2nd in the nation for amount of need-based aid provide per student. However, many students over the years were left unserved due to lack of sufficient funds in the grant program. In 2019, as part of an effort to focus funding on achieving the state’s education attainment goal – the governor and legislature enacted the Workforce Education Investment Act. The legislation transforms the SNG Program into the Washington College Grant – now guaranteeing need-based aid to students at or below the median family income (MFI). A broad coalition of stakeholders worked to make the investment possible, including business leaders who supported an increase in the business and occupational tax to provide the necessary revenue. Key features of the Washington College Grant include: a broad set of education pathways eligible – from bachelor’s degrees to apprenticeships; maximum awards based on public sector tuition, from $4,000 at 2-year colleges to $10,000 at 4-year research universities; awards based on median family income with eligibility pro-rated up to 100% of MFI; not “last dollar” so combines with other aid to help cover the cost of attendance. The award guarantee supports messaging and predictability for students and families. Leading up to this legislation, the Washington Student Achievement Council and Dr. Jim Fridley – an engineering professor at the University of Washington – developed an interactive model for college affordability (AIM). The model allowed stakeholders to better understand how funding sources interact and impact costs to students. For example, the model can visualize the impact on a student of receiving or not receiving a need-based grant relative to other sources of support – such as federal Pell grants, family savings, or student work. This model is now available for other states, including Kentucky.
Step 1: Understanding College Affordability in Kentucky without State Financial Aid
Figure 1. Paying for College without State Aid: Student from a Family of Four at a Kentucky Public Four-Year Institution in 2016-17, by Family Income Level

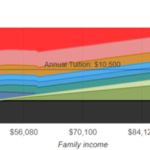
Figure 1 – a snapshot from the affordability model – visualizes how an in-state, dependent student at a public Kentucky 4-year university from a family of four, might put together the resources to pay for college. The assumptions used are described in detail below and can be adjusted using the online tool to see how the results change.
The total annual cost of attendance (tuition and fees, room, board, books and transportation) is $24,600 and is represented on the vertical y-axis. Family income is represented on the horizontal x-axis with the median income for a family of four in Kentucky being approximately $70,100. One can see how relative affordability changes at different levels of income.
The state appropriation (black bar) is generally invisible to students, but without it, tuition would likely be higher. The black bar approximates the state appropriation as a dollar amount per full-time equivalent student, in this case about $7,600. It is important to note that this for reference and does not change the total cost of attendance for a student.
To estimate contributions from current family income (light green bar) and college savings (dark green bar), users need to decide at what income level it is appropriate to expect any contribution at all – the family income exclusion – and what percentage of income above that level should be saved before or contributed during college. In this example, no contribution is expected below 200% of the federal poverty line, or about $50,000 for a family of four in Kentucky. Above that level, this example assumes a family contributes 5% of current income and saved 5% of income for ten years prior to enrollment for college, earning a 1% interest rate above inflation.
Based on these assumptions, a family of four with income of $70,000 would be expected to provide about $2,900 per year from savings and $1,100 from current income toward college expenses. The same family with income of $35,000 a year would not be expected to contribute from either current income or savings.
Federal Pell grants help lower-income students with college costs and are represented by the blue bar. In this case, the family with $35,000 would qualify for $5,800 in Pell grants, while the family with the $70,000 income would not qualify.
Next to consider is income from student work (orange bar). This example assumes every student could contribute all income from working 500 hours a year at the state’s minimum wage of $7.25 an hour – a total of $3,300.
After students’ contribution, debt is the last option considered. The model defines affordable debt (light red bar) as what students who complete are likely to be able to pay back with a reasonable percentage of income. In this example, that amounts to about $5,100 per year, based on what 80% of Kentucky bachelor’s degree graduates could afford to pay with 10% of their income at 5% real interest over ten years.
After all resources above are considered, what is left, if there is anything, is unaffordable given the assumptions selected. Institutional aid may provide assistance to cover this for some students, although typically students would not know how much until after they applied. Alternatively, students may borrow more in student debt than is considered affordable, work more hours, or choose not to enroll. The model uses unaffordable debt (dark red) to visualize the remaining costs. In this example, the family with the $35,000 income would have $9,400 in remaining costs and the family with the $70,000 income would have slightly more at $9,800. These numbers show the impact of Pell grants on low- incomes students relative those with slightly higher incomes who can contribute more from savings and income.
Step 2: Understanding How State Aid Affects Affordability – Adding in KEES & CAP
Figure 2. Paying for College with State Aid: Student from a Family of Four at a Kentucky Public Four-Year in 2016-17, by Family Income Level

Figure 2 displays how the addition of state financial aid impacts the amount of unaffordable debt.
Most Kentucky high school graduates enrolling in college receive some funds from the Kentucky Educational Excellence Scholarship (KEES) which is earned based on academic performance during high school. The average amount in this example varies a little – about $1,700 for the student from the family with the $35,000 income and $1,800 for the student from the family at $70,000.
Low-income students may also receive the College Access Program (CAP) grant based on their Pell-eligibility. In this example, the average for those eligible about $1,700.
While these state financial aid programs play a critical role in reducing the level of unaffordable debt, there is still quite a large area of dark red for low- and middle-income students. With these two programs, the level of unaffordable debt is reduced to about $6,000 for the family with the $35,000 income and about $6,300 for the family with the $70,000 income. The latter family’s ability to save, contribute current income, and eligibility for federal tax credits makes up for most of the phase-out of federal Pell grants, given the assumptions in the example.
What does the Interactive Model Really Provide?
First off, go explore the model – again linked here. It offers a reasonable starting point for a discussion about what should be of interest students, institutions and policy makers – namely: determining how to measure affordability, defining affordability goals, and developing parameters for students’ share of costs.
While the modeling cannot answer all questions and satisfy all demands, using it as a tool can impact how we Kentucky chooses to align funding to postsecondary institutions, financial aid, and tuition; illustrate impact of funding policies on all students; support strategic investment and policies to make postsecondary more affordable; and communicate expectations for the responsibilities of each stakeholder – the state, institutions, and students.
In part III of this post, we’ll highlight some innovative ways Kentucky institutions are supporting student success and point forward to what questions lie ahead.


Comments are closed.